Actual · Revenue Intelligence
Turning a revenue number
into the decisions behind it.
We designed a revenue system that explains why the quarter moved, which accounts caused it, and what closing the gap would actually take.
- Role
- Product Design
- Platform
- Web App
- Industry
- Revenue · Enterprise
01 · The Challenge
Every revenue tool reports the miss. None of them explain it.
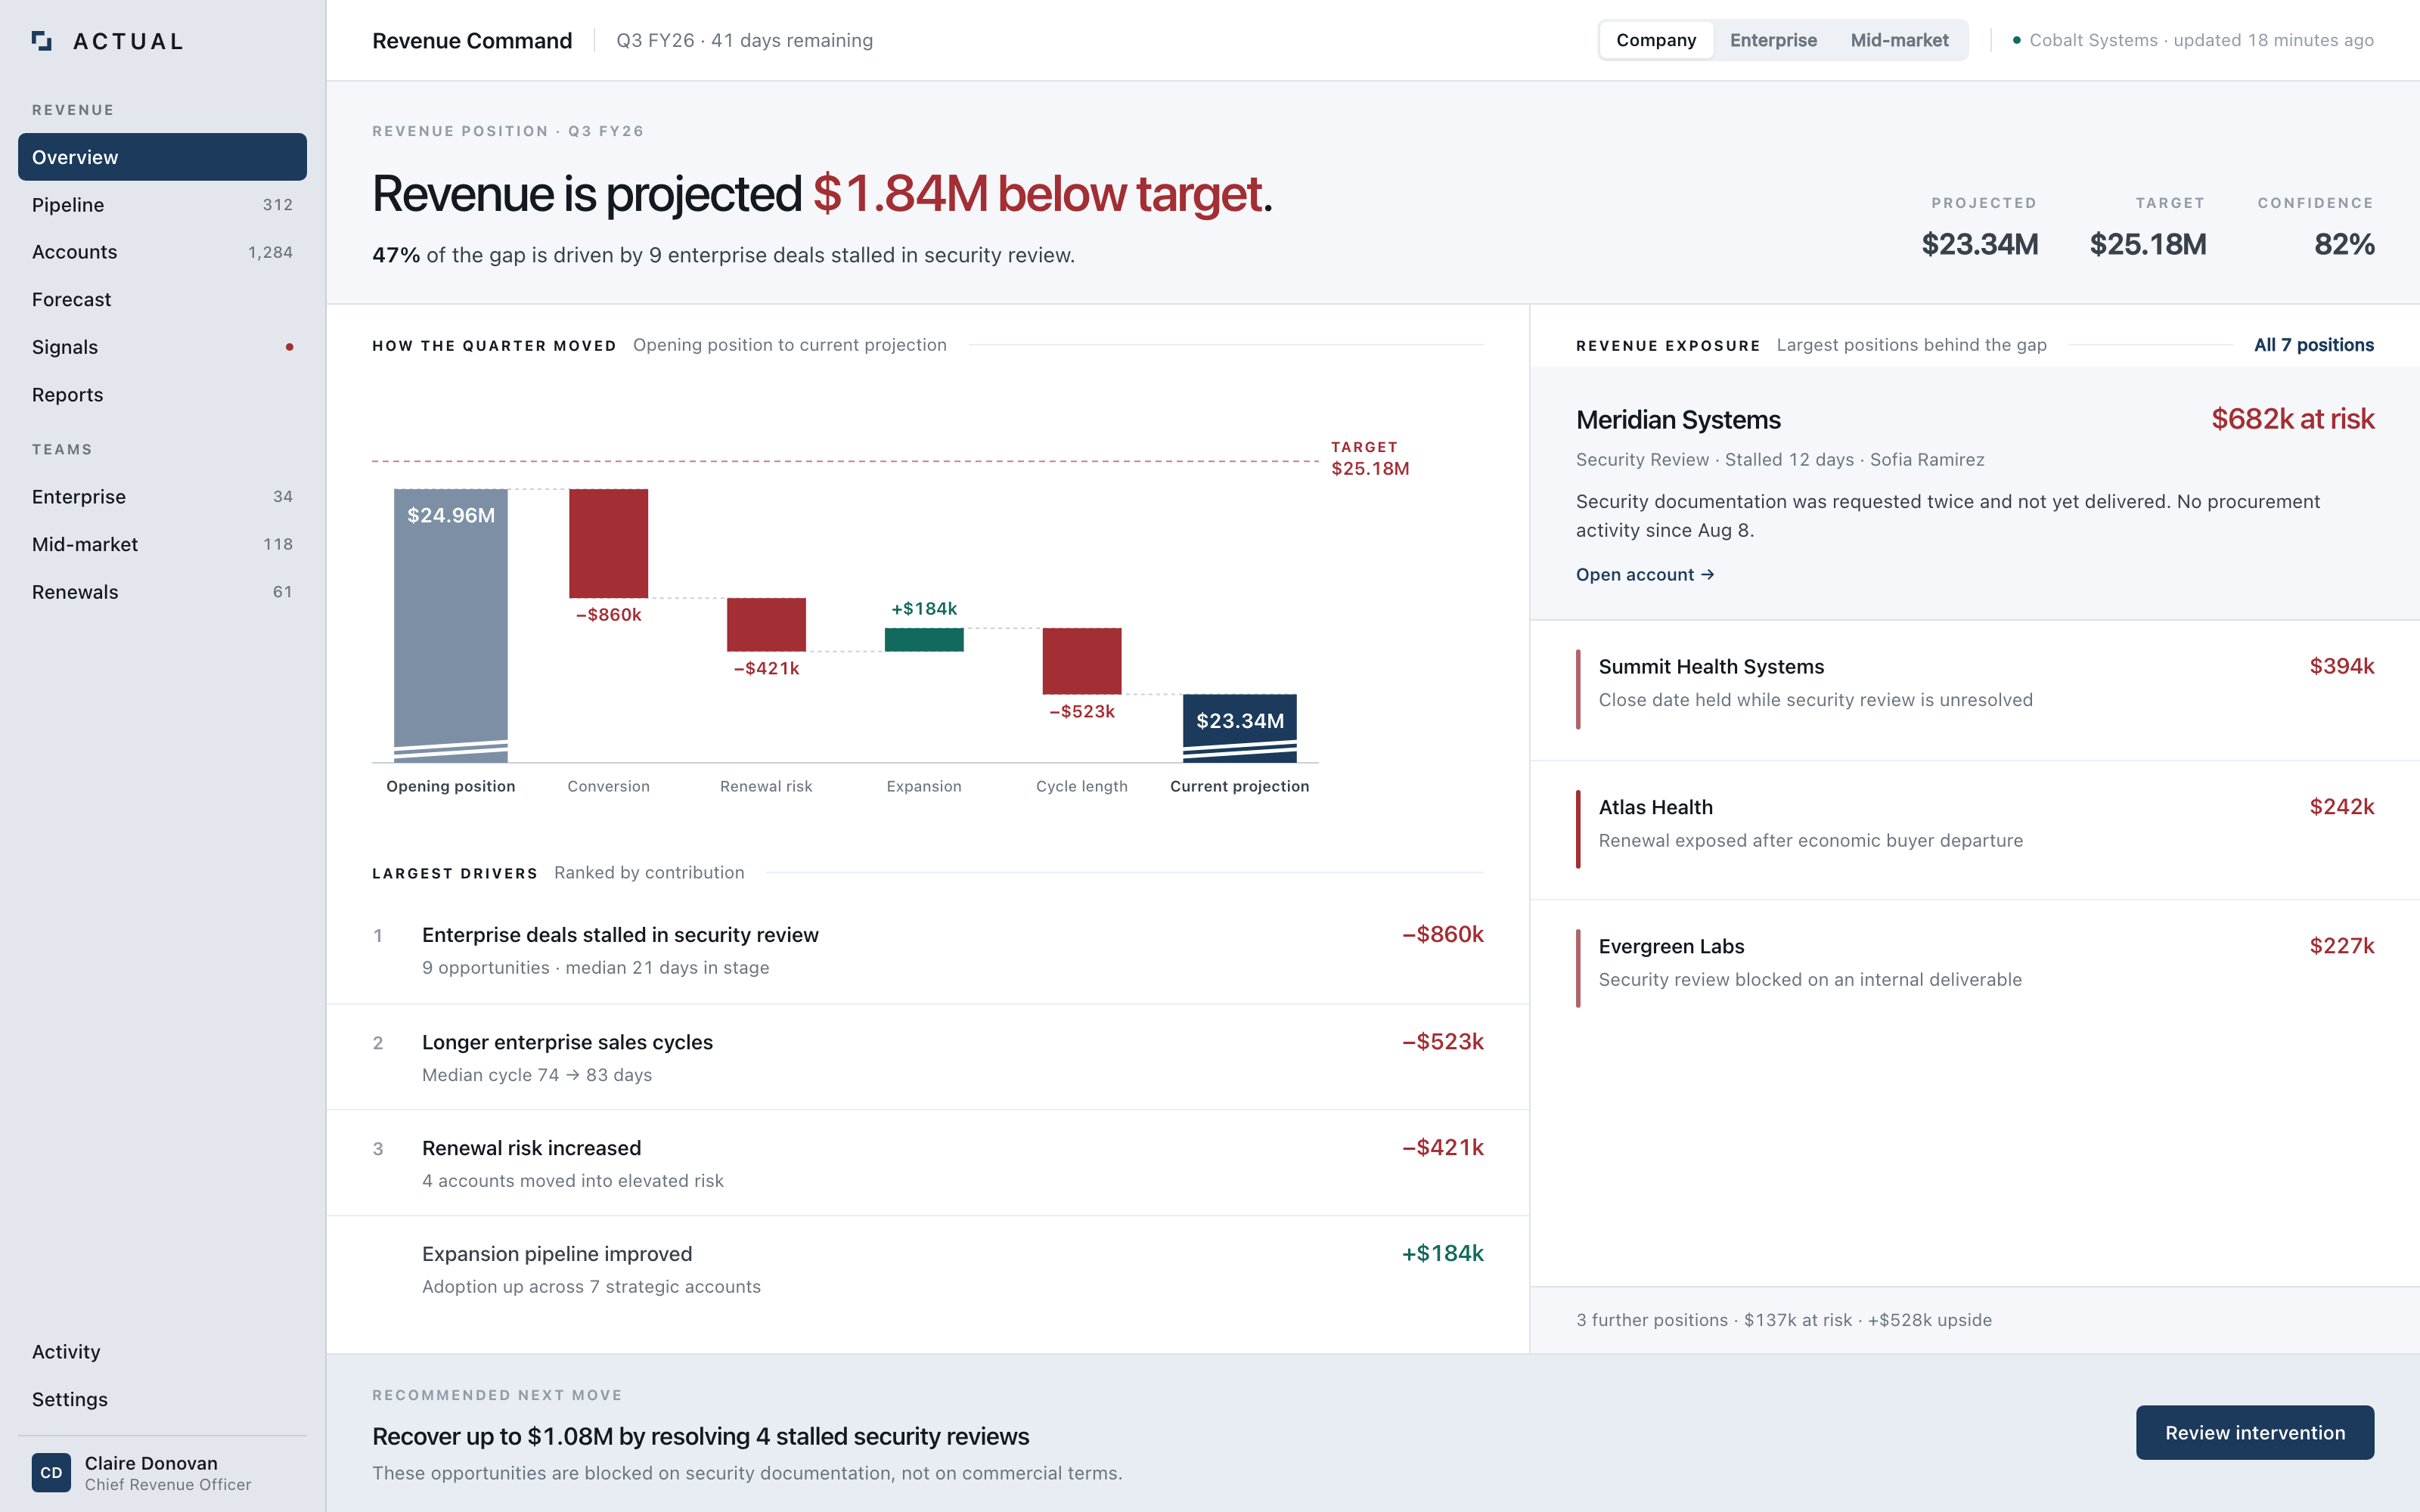
Leaders can see that the forecast is short. What they cannot see is which movements produced it, which accounts sit behind those movements, and which of them is still recoverable with 41 days left in the quarter.
02 · Revenue Command
One number, decomposed into its causes.
The opening view states the position in a sentence, then breaks the quarter into the movements that created it and the accounts carrying the exposure.
- below target
- $1.84Mbelow target
- from one cause
- 47%from one cause
- movements ranked
- 5movements ranked
- positions behind the gap
- 7positions behind the gap
03 · Account Intelligence
A judgment, with the evidence that produced it.
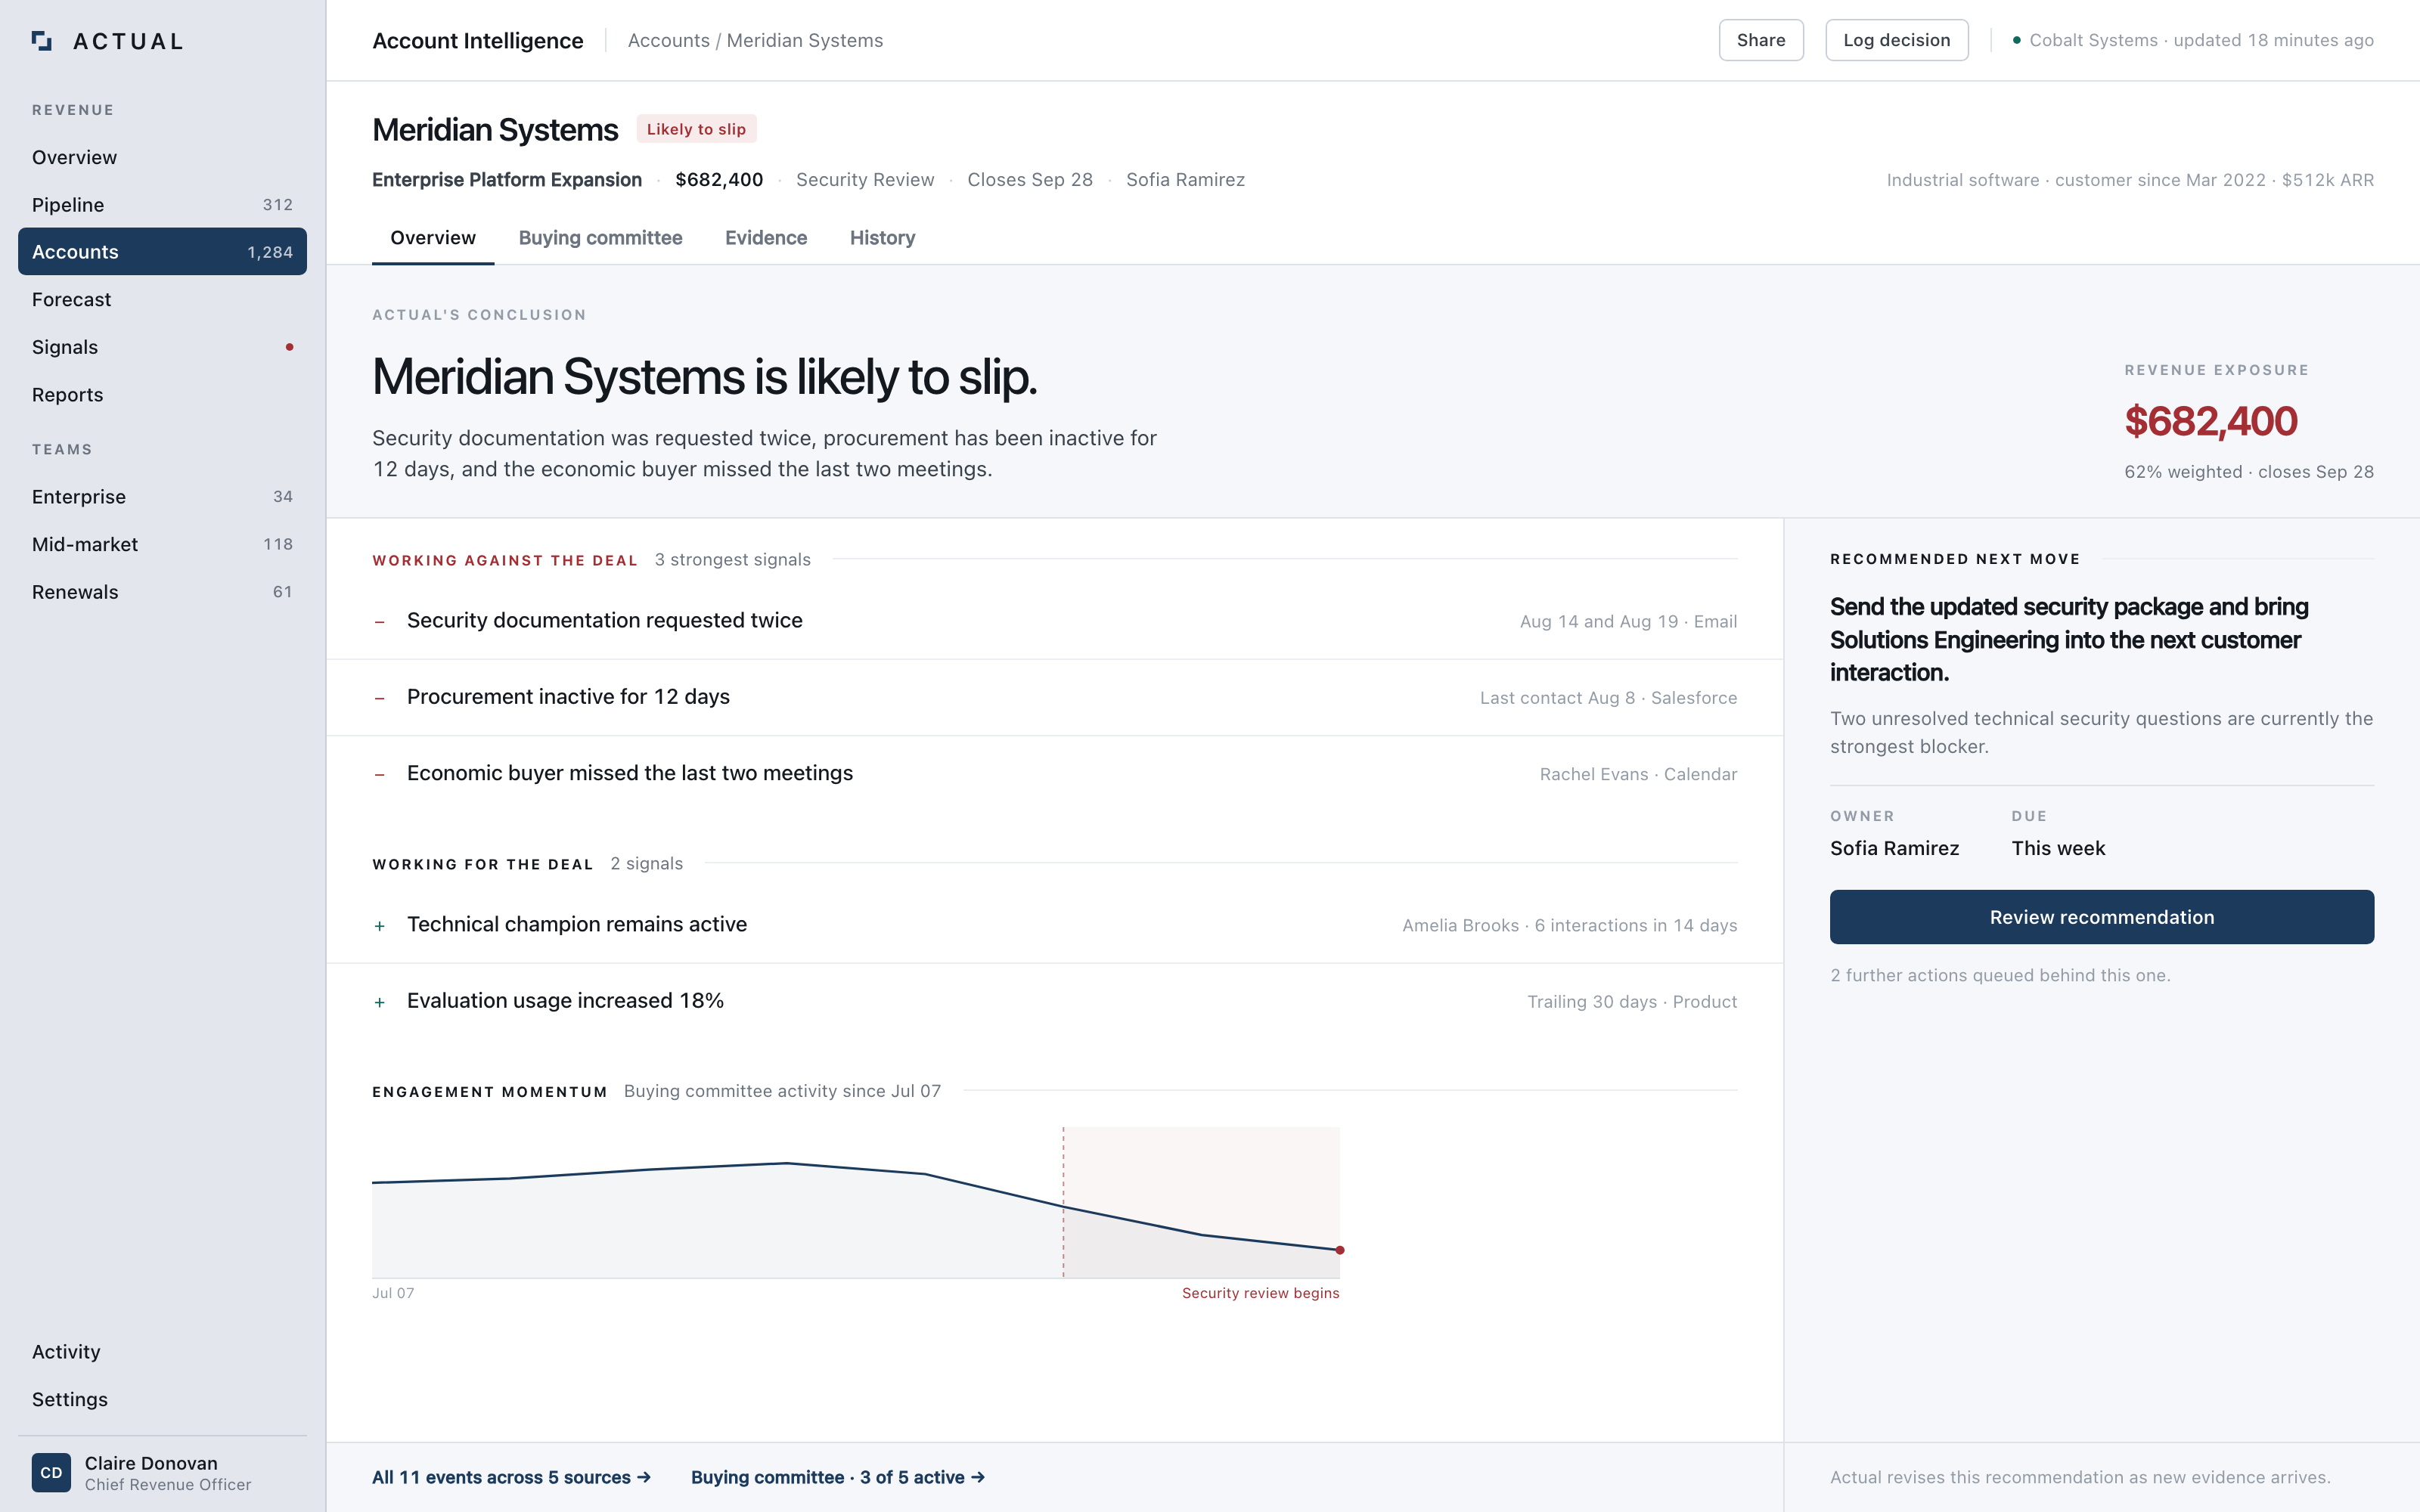
Each account opens on a conclusion rather than a dashboard. The signals working against the deal and the signals working for it sit beside it, each dated and attributed to the system it came from, so the reasoning can be challenged instead of accepted.
- across 5 sources
- 11 eventsacross 5 sources
- revenue exposure
- $682,400revenue exposure
04 · Scenario Model
What closing the gap would actually take.
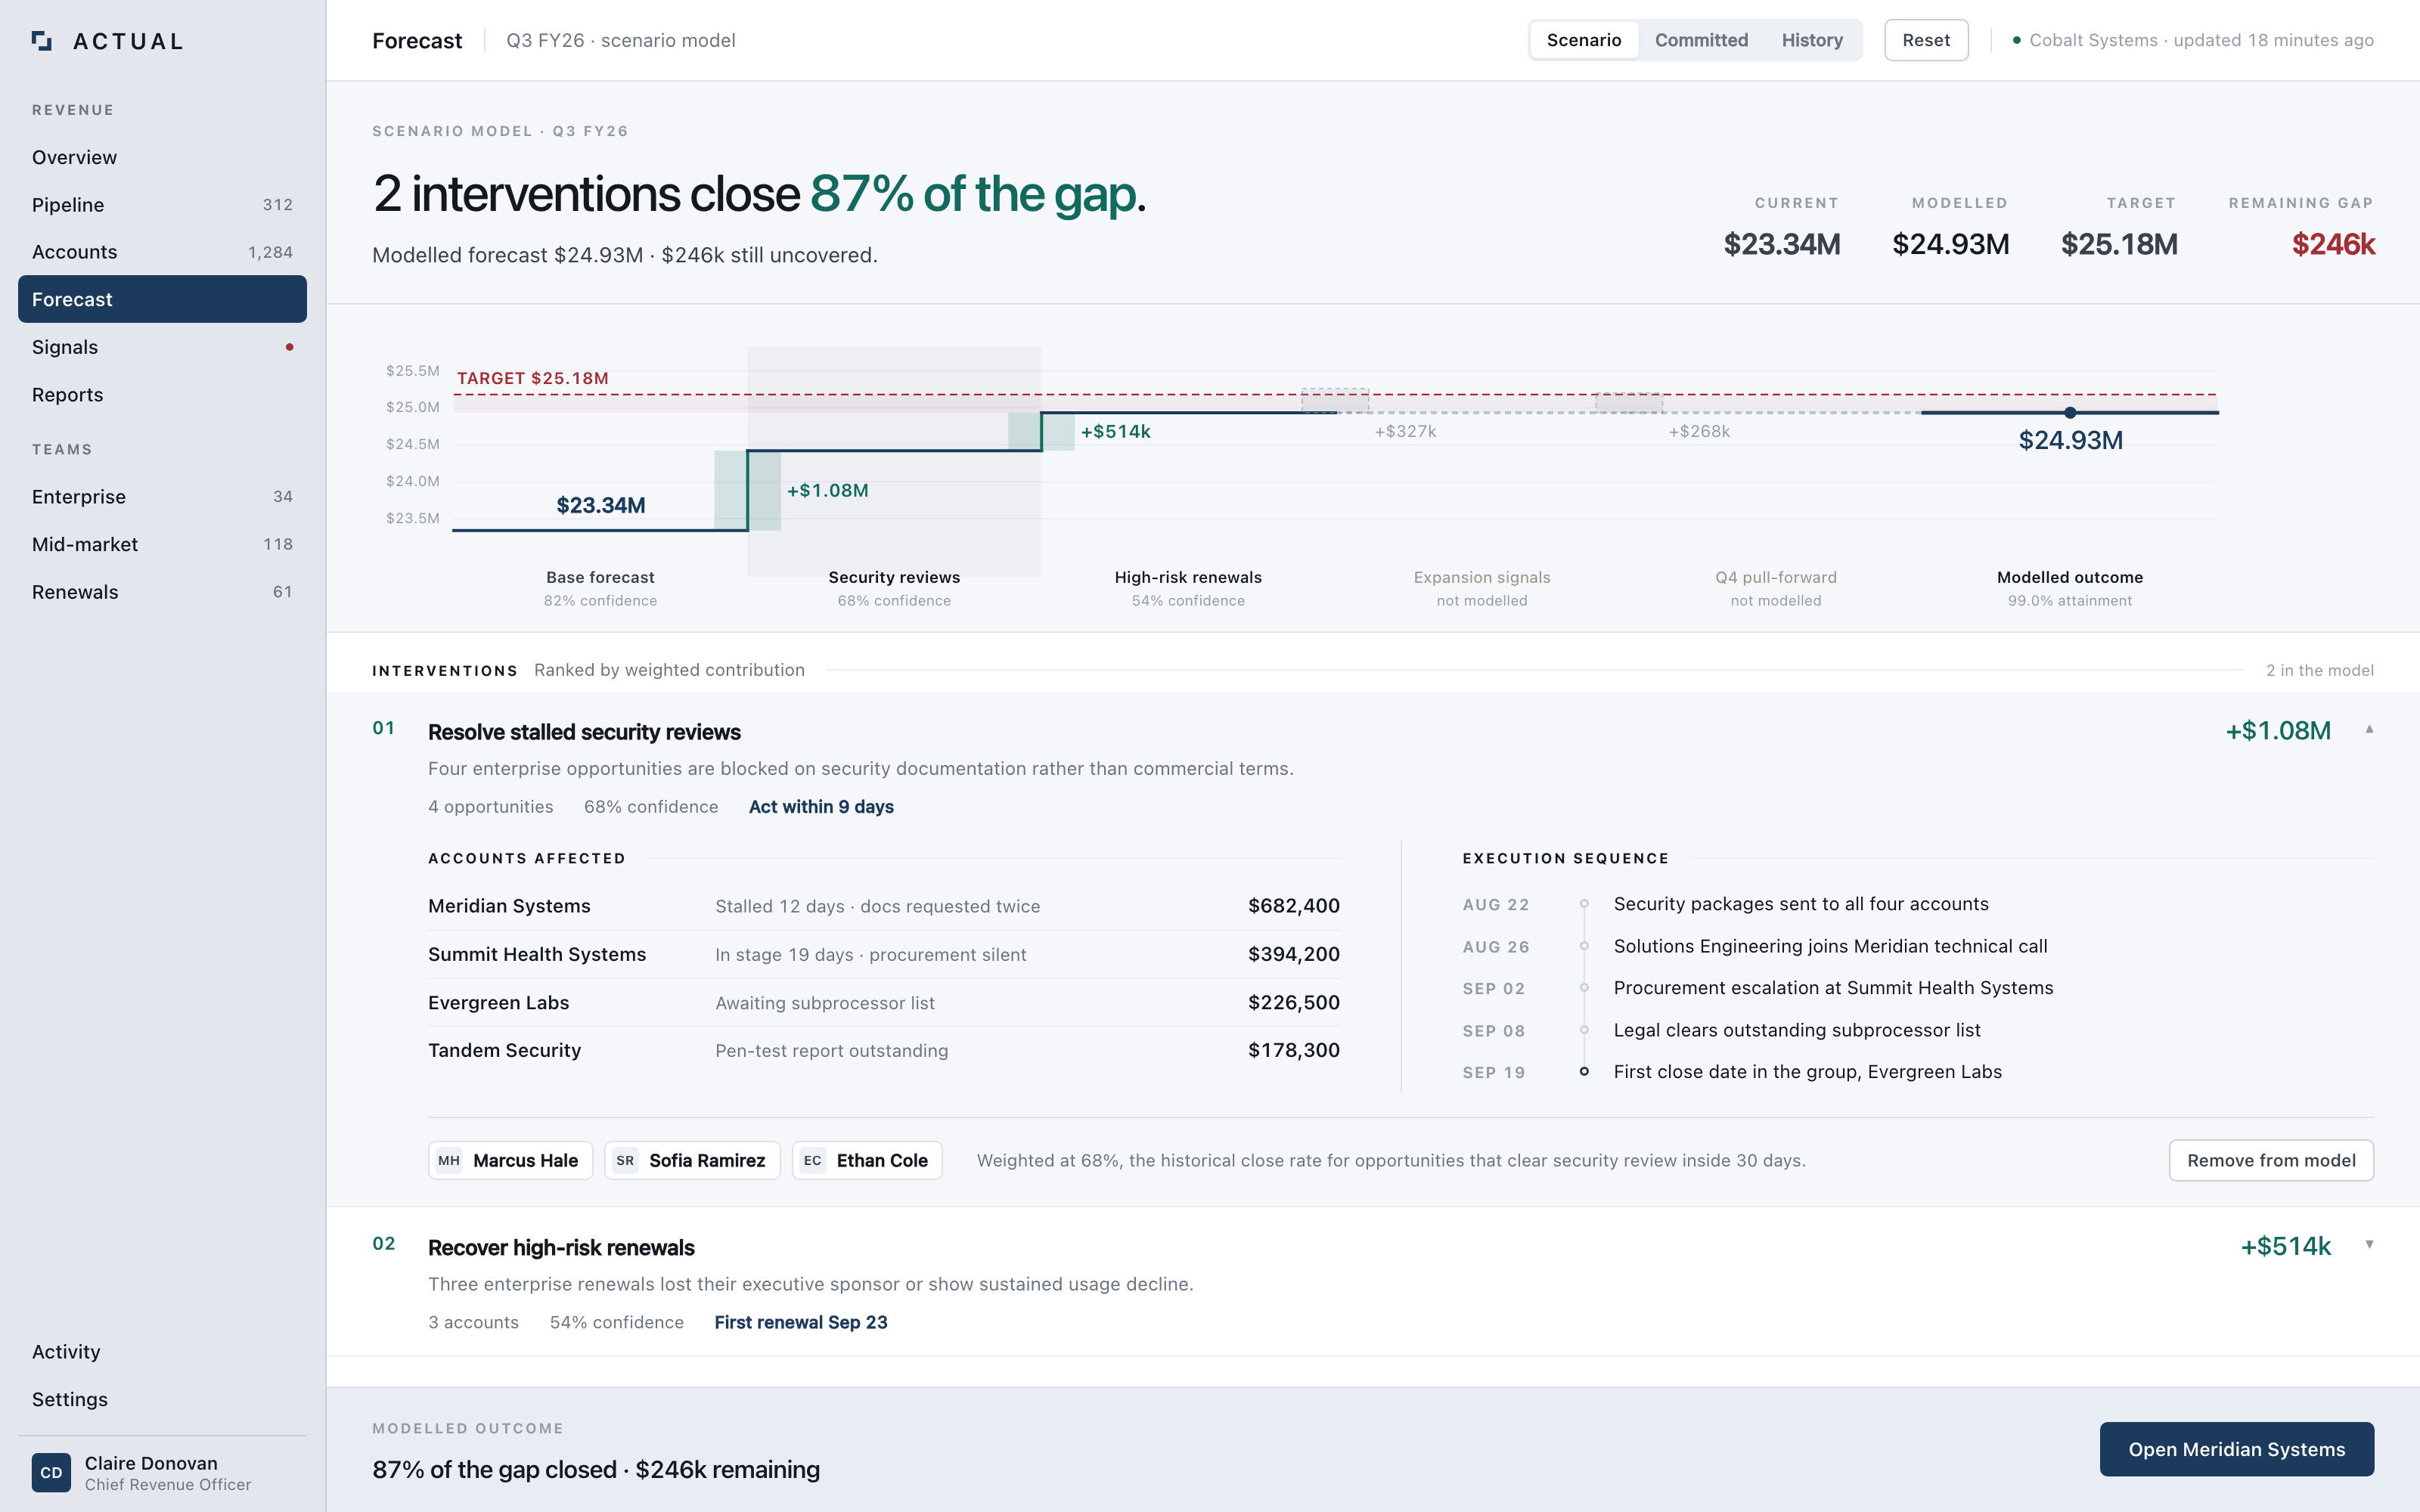
Interventions are modelled, not assumed. Each one carries its weighted contribution, its confidence, the accounts it touches, and the sequence of work required before the first close date passes.
- of the gap closed
- 87%of the gap closed
- modelled recovery
- $1.59Mmodelled recovery
- still uncovered
- $246kstill uncovered
05 · The Outcome
A forecast that argues for its own conclusion.
Actual moves revenue work from reporting to decision-making: the gap has a cause, the cause has accounts, the accounts have evidence, and the path back to target is something a team can execute against.
Building a complex product?
We turn complicated workflows into products people can understand and trust.
Start a project